Your revenue is directly driven by customer behaviours. Simply opening the shop doors and relying on customers to do what they always did is not a growth plan. So what should a successful retail revenue plan look like?
Although “last year +” is an easy way of tracking revenue growth, it is not a very useful planning tool. It assumes that customer behaviours have stayed the same – which they haven’t. It also assumes that your cost base has remained stable – which has also changed significantly. If you need an example of how quickly behaviours and costs can shift, consider the first COVID lockdown in 2020.
Also a total figure for revenue (for a year or a month) is not a plan. It is an objective or goal, but on it’s own, does not guide you day to day. A plan should outline how you will achieve that objective for both top and bottom line revenue. It is also worth noting this distinction.
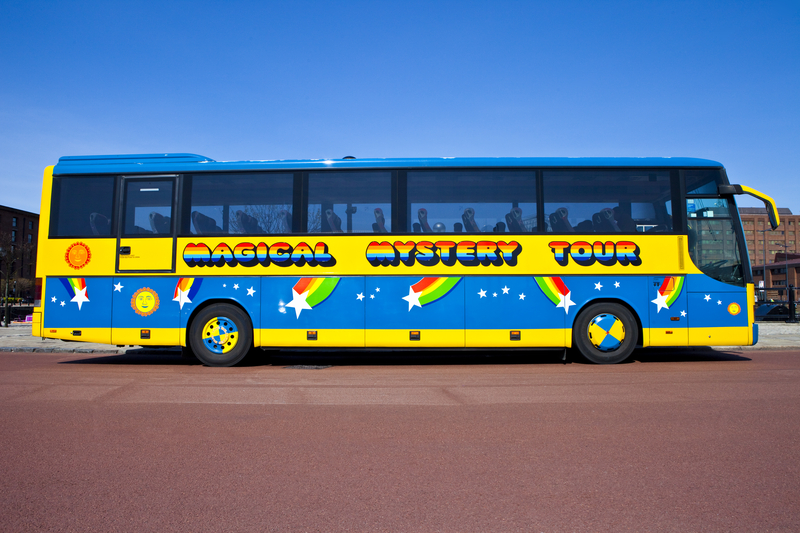
Ask yourself, do you have an annual retail plan to track against? Or are you waiting to see where you end up? In other words are you a passenger on a magical mystery tour, or the driver of the coach?
The coach passengers have no control over how the journey unfolds. They have no say in whether you reach the destination. Some don’t know (even roughly) where the journey will end.
The driver however starts with a planned route to a destination.

So what are the three stages to creating a SMART Retail Revenue Plan.
Stage 1: Set the Objective.
As an example, in this month, last year, sales totaled £100k revenue, with £35k net profit. Your aim is broadly to exceed one, or both of these targets. However, this objective has no real measurement yet.
- How much more revenue and profit do you want to / need to make (by week, month, year)
- Your objective should be taken down to the department level. The sum of the smaller parts makes the total.
Stage 2: Set realistic targets / measures:
- Look Back:
- What were the customer behaviours helped you to reach this figure, last year (at total and department level). In this example, there were a total of 5,500 transactions of average spend £18.18 and average profit per basket of £6.36.
- Now you have a framework that you can start to build your revenue plan around. This covers key customer behaviours (transactions, average spend) and business metrics – profit per transaction.
- Look Forwards:
- There are only 3 ways to increase your revenue from last year
- Increase customer base – to the shop or a department
- Increase basket spend – quantity of purchase in regular transactions
- Increase frequency of purchase
- How are you planning to change customer behaviours to meet your objective? More transactions (customers / frequency)? Increased spend? A combination of the two?
- Answering this will then enable you to start putting meat on the bones of your objective.
- If you’re not planning to change customer behaviours, then you’re not planning to grow.
- Set realistic objectives –
- Assess whether these are possible, based on current / expected behaviours. Are you going to increase basket spend by £10 per customer? How will you attract 1,000 more transactions per month? Incidentally Both are achievable…..
You now have a series of measurable variables that you can track against actual customer behaviours – a plan!
Stage 3: Start the journey
You now have your journey mapped out and away you go! But there are two types of coach driver, which one will you be?

- Driver A – sticks rigidly to his route, irrespective of what they encounter en-route. Some days he arrives at the destination on time. On other days he is held up by unexpected obstacles and arrives late, or not at all. They justify the under-performance by external factors – weather, road works, congestion etc
- Driver B – tracks the journey. They may revise their route if the Sat Nav (EPOS) gives them some warning of changing conditions. They may also drive a little faster at times to make up for lost time. They will often reach the destination early. But if they do run out of time, they will normally finish closer to the final destination than driver A.
Both drivers have a plan. Driver B, however, reacts to change. They are willing to change the route or do something different to reach the destination. Which are you?
Data Strategy Consulting work with our clients to help them build and deliver strategic plans that grow revenue and profits.
If you’d like to see an example of a retail revenue plan, please get in touch. You can also contact us for a no obligation discussion to find out how we can help you.

Comments are closed